
Single-family investment analysis for buy and hold, fix and flip, and wholesale
The same house is three different investments depending on what you plan to do with it. Each exit gets its own model — the inputs that matter, the costs that kill it, and the number that decides it.
Free account creation. A paid plan is required to analyze your own deals.
Explore a sample single family deal → A real published report, built on sample deal data.
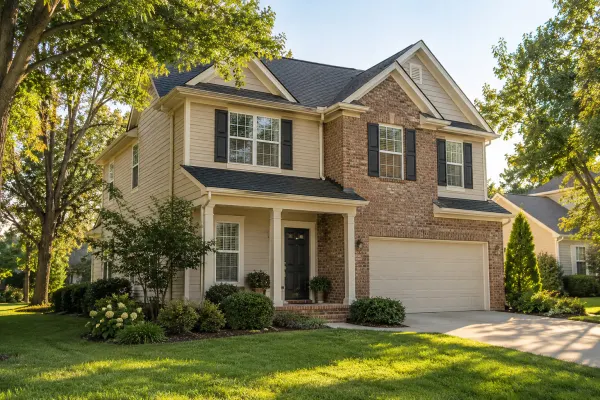
Check both sides of a wholesale deal
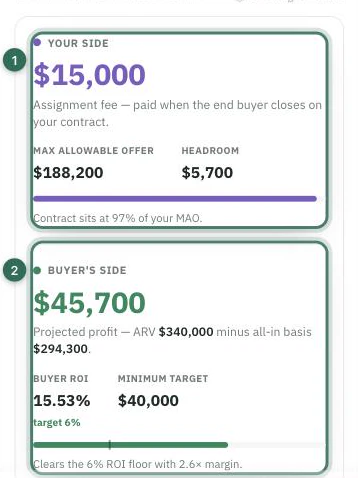
The wholesale model separates your assignment fee and offer headroom from the end buyer’s projected profit and ROI. Buy-and-hold and fix-and-flip have their own workflows.
Single-family investment analysis is the process of testing one house against the exit you intend for it. A buy-and-hold is judged on rental cash flow and cash-on-cash return after debt; a fix and flip on profit after rehab, carry and selling costs; a wholesale on the spread between the contract price and what an end buyer can pay. DealWorthIt models all three separately rather than stretching a rental calculator over exits it was not built for.
What you put in, and what comes out
Every figure below is an input on the single family workflow or a metric it computes. Assumptions stay visible and editable — including the ones read from an imported document.
Key inputs
- Buy and hold: purchase price, rent, operating expenses, financing, vacancy
- Fix and flip: purchase price, rehab budget, after-repair value, hold period and financing costs
- Wholesale: contract price, after-repair value, repair estimate, assignment fee
- Closing costs, selling costs and the carry that runs while you hold
- Property, tax and ownership data pulled from research rather than guessed
Analysis outputs
- Buy and hold: monthly cash flow, cap rate, cash-on-cash return, DSCR
- Fix and flip: net profit and return on cost, after rehab and carry
- Wholesale: assignment spread, and the maximum fee the deal still supports
- The downside case — profit re-run at a higher rehab cost or a lower ARV
- A deal report and PDF on every plan; saved, customizable investor reports on Gold and Diamond
What the single family workflow does
Three models, not one calculator
Buy and hold, fix and flip and wholesale are separate workflows in the application with separate inputs and separate outputs. A flip’s hold period is a cost driver; a rental’s is a growth driver. Collapsing them into one form is how a spreadsheet ends up quietly wrong.
The clock is an expense
A flip pays for every month it takes: financing and holding costs run for the whole hold period, and the model carries them against the profit rather than leaving them in your head. A two-month schedule slip shows up as a number, not as optimism.
Research attached to the address
Ownership, mortgage balance and equity, tax and assessed value, sales and MLS listing history, flood zone and sales comparables are available on the property itself — so the ARV and the repair assumption start from records rather than from a guess.
Downside first
These deals fail when the rehab estimate runs over and the comps come in under at the same time. Every assumption in the model stays editable, so the pessimistic pair — higher budget, lower ARV — is a re-run, not a rebuilt spreadsheet, and worth pricing before you sign.
The analysis is one stage of five
DealWorthIt is a real estate investment intelligence platform, not a standalone calculator. The single family model sits inside the same workflow that found the property and will present the result.
Find
Discover on-market and off-market opportunities.
Research
Review ownership, debt, tax, property, comparable, and market data.
Analyze
Underwrite deals using asset-specific financial models.
Compare
Test scenarios and assumptions side-by-side.
Present
Create clear reports for investment decisions, partners, and teams.
Other investment types: Multifamily · Self-Storage · New Construction
Single Family analysis, answered
You analyze a rental property by working down from gross rent to what actually reaches you. Start with market rent; subtract vacancy, operating expenses, taxes, insurance, maintenance and any management fee to get NOI; subtract debt service to get cash flow. Cash-on-cash return is that annual cash flow divided by the cash you put in — down payment, closing costs and rehab — and it is the number that tells you what the deal does for you, as opposed to cap rate, which tells you what the property does regardless of how you financed it.
The 70% rule is a screening shortcut: offer no more than 70% of after-repair value minus the repair estimate. It is a filter, not an underwrite — it says nothing about your carry, your financing costs, or how long the property will actually sit. Use it to decide which deals deserve a closer look, then run the full flip or wholesale model before you write the offer, because the shortcut and the real number can sit far apart on the same house.
Cash-on-cash return is annual pre-tax cash flow divided by the total cash invested, expressed as a percentage. If a rental produces $4,800 a year in cash flow on $60,000 of down payment, closing costs and rehab, the cash-on-cash return is 8%. It measures the return on money you actually put in, which is why it moves when your financing moves — unlike cap rate, which does not.
Run your next single family deal through it
Find the property, research it, analyze it with the model built for it, compare the scenarios that matter, and hand your partners a report they can read.