
Self-storage analysis software that starts from the unit mix
Storage income is built a unit at a time, not a lease at a time. Build revenue from the mix and the rate per square foot, keep economic occupancy honest, and carry it through to NOI, debt and exit.
Free account creation. A paid plan is required to analyze your own deals.
Explore a sample self-storage deal → A real published report, built on sample deal data.

Start with the unit mix
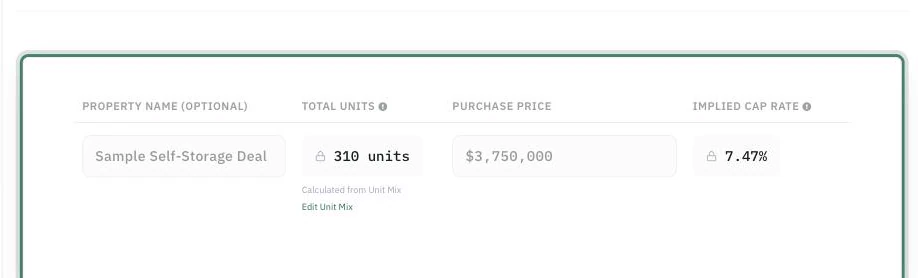
The workspace derives total units from the unit mix and puts the implied cap rate beside your purchase price. Review unit sizes, rents and occupancy before projecting the hold.
Self-storage analysis is the process of building a facility’s revenue from its unit mix and street rates, discounting it to what is actually collected, and carrying the result through expenses, debt and an exit to a return. It differs from apartment underwriting in where the income comes from — rentable square feet and rate per square foot rather than a rent roll of leases — and in how much of the gap between asking rent and collected rent is concessions, delinquency and vacancy rather than vacancy alone.
What you put in, and what comes out
Every figure below is an input on the self-storage workflow or a metric it computes. Assumptions stay visible and editable — including the ones read from an imported document.
Key inputs
- Purchase price and net rentable square feet
- Unit mix by size, and the street rate for each
- Rate per square foot per month
- Economic occupancy — collected rent, not just rented units
- Other income: tenant insurance, admin fees, late fees, retail
- Operating expenses, including management, payroll, property tax and insurance
- Debt: loan-to-value, rate, amortization
- Growth, expense inflation and exit-cap assumptions
Analysis outputs
- Effective gross income and NOI
- Revenue per net rentable square foot
- Cap rate at your price
- DSCR and debt yield
- Cash-on-cash return
- Pro forma cash flow across the hold
- IRR, equity multiple and exit value
- Sensitivity grid across rate and exit-cap movement
- A deal report and PDF on every plan; saved, customizable investor reports on Gold and Diamond
What the self-storage workflow does
Unit-mix income build
Enter the mix by unit size with a rate for each, and the model builds gross potential income from it rather than from a single blended rent — so a facility heavy in 10×10s and a facility heavy in 5×5s do not look the same on paper when they are not the same business.
Economic occupancy, not headline occupancy
Headline occupancy counts rented units. What pays the debt is collected rent — net of concessions, delinquency and long-tenured tenants sitting below street rate. The model works in economic occupancy, so the revenue you underwrite is the revenue the facility actually collects, and the gap up to street rate stays visible as the upside it is.
Storage-specific underwriting guidance
The application carries a self-storage methodology of its own rather than reusing the multifamily one, and it is deterministic — the same inputs always produce the same guidance, with no language model in the path.
Scenario comparison
Test a rate increase, a lease-up ramp, an expense-ratio change or a different exit cap as saved scenarios on the same facility, and compare them side by side. Silver includes 3 scenarios per deal, Gold 10, Diamond unlimited; side-by-side comparison is a Gold and Diamond feature.
The analysis is one stage of five
DealWorthIt is a real estate investment intelligence platform, not a standalone calculator. The self-storage model sits inside the same workflow that found the property and will present the result.
Find
Discover on-market and off-market opportunities.
Research
Review ownership, debt, tax, property, comparable, and market data.
Analyze
Underwrite deals using asset-specific financial models.
Compare
Test scenarios and assumptions side-by-side.
Present
Create clear reports for investment decisions, partners, and teams.
Other investment types: Multifamily · Single Family · New Construction
Self-Storage analysis, answered
You analyze a self-storage property by building income from the unit mix and rate per square foot, then discounting it to what is actually collected. Multiply each unit size by its street rate to get gross potential income; apply economic occupancy — not just physical occupancy — to get effective gross income; add other income such as tenant insurance and admin fees; subtract operating expenses to get NOI. From there it is the same as any income property: apply debt for DSCR and cash flow, and apply an exit cap across your hold for IRR and equity multiple.
Economic occupancy is collected rent as a share of gross potential rent — what the facility actually earns against what it would earn if every unit paid the street rate. Physical occupancy only counts occupied doors, so a facility can be 92% physically occupied and 78% economically occupied once concessions, delinquency and long-tenured tenants sitting below street rate are counted. The gap between the two numbers is usually where a value-add case lives.
Revenue per square foot is annual income divided by net rentable square feet, and it is the metric that makes facilities of different sizes comparable. It is worth computing on both gross potential and collected income: the difference between the two tells you whether a low figure means weak rates or weak collections, which are different problems with different fixes.
Run your next self-storage deal through it
Find the property, research it, analyze it with the model built for it, compare the scenarios that matter, and hand your partners a report they can read.