
How to Underwrite Rent Growth in 2026: Why National Averages Can Mislead Investors
Part of the Multifamily Investing guide.
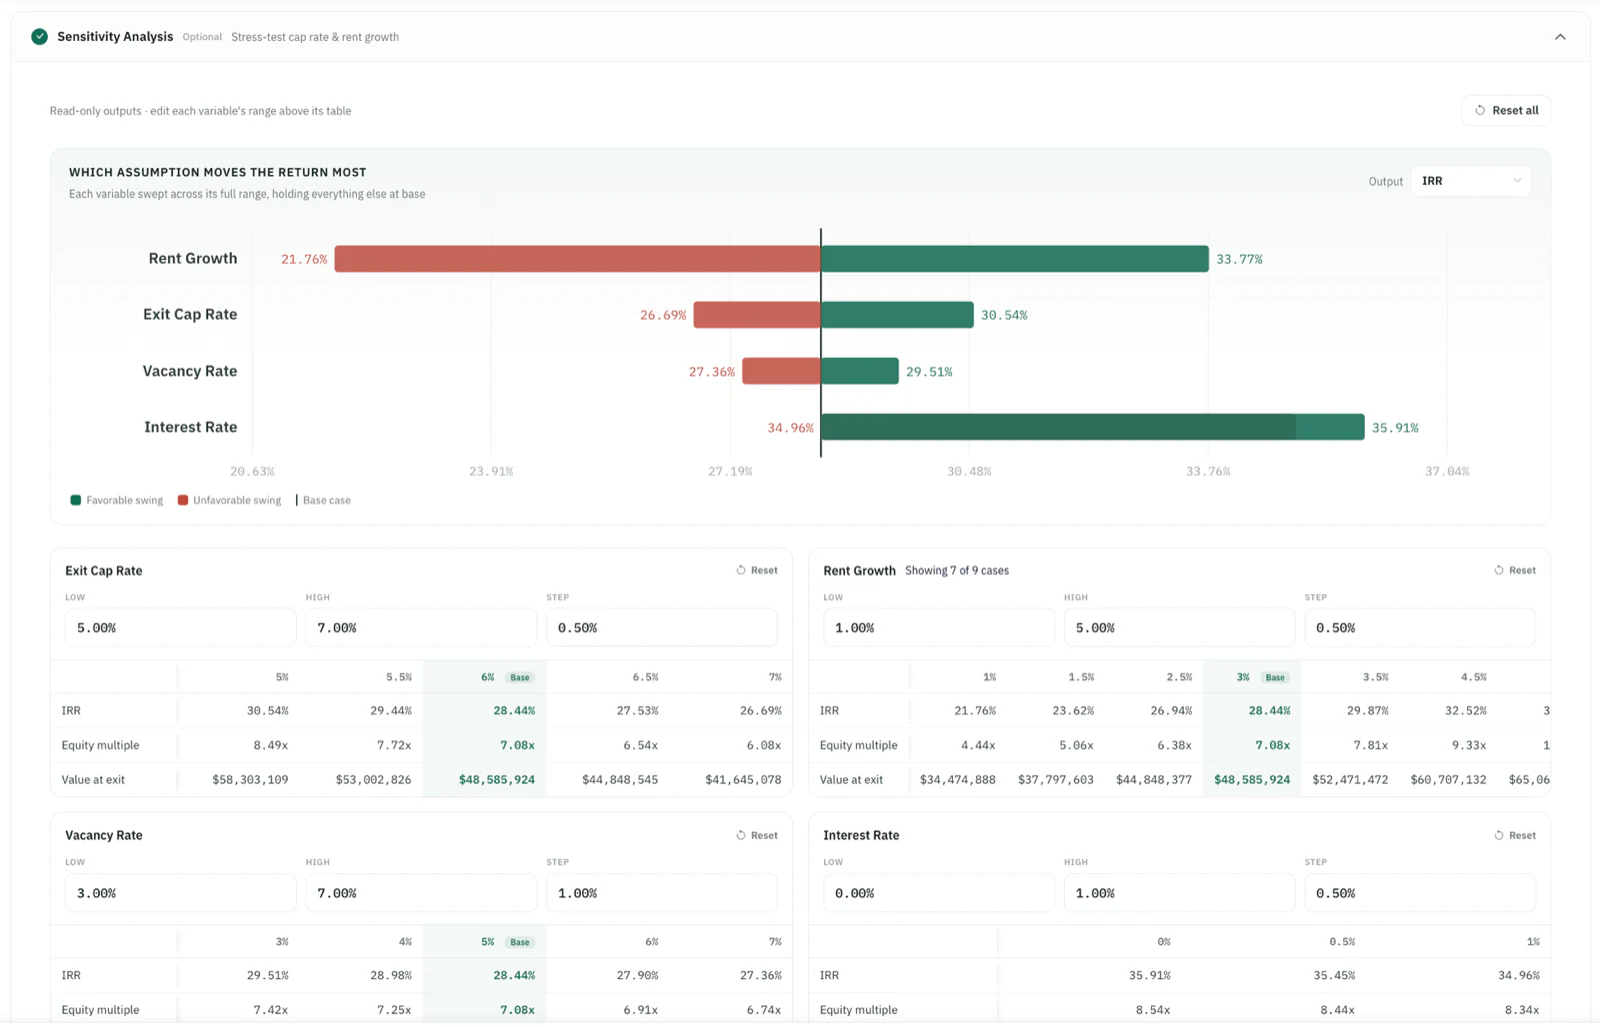
Rent growth assumptions can make or break a multifamily underwriting model. In 2026, investors should avoid using one flat national rent growth assumption across every deal. National rent growth remains modest, but local performance varies by supply, occupancy, concessions, job growth, asset class, and submarket. A better approach is to underwrite rent growth using market evidence, base/upside/downside scenarios, and realistic lease execution timing.
Most investors default to 3% annual rent growth. It is a round number, it feels conservative against a long-run historical average, and it rarely gets challenged in an investment committee.
In 2026, that habit is a problem in both directions. In several oversupplied Sun Belt metros, 3% is aggressive — advertised rents there have been falling, not rising. In some supply-constrained coastal and Midwest markets, 3% may actually understate what operators have been achieving.
Rent growth is not a cosmetic input. It flows into rental income, effective gross income, NOI, valuation, exit value, cash flow, DSCR, IRR, equity multiple, and ultimately the price you can justify paying. Get it wrong by two percentage points and a five-year hold can swing by more than a million dollars of exit value on a mid-sized deal.
This guide covers how to pick a rent growth assumption you can defend, what the 2026 data actually shows, and how to stress-test the assumption before you make an offer.
Want to test rent growth assumptions before making an offer? DealWorthIt helps you compare base, upside, and downside scenarios so you can see how rent growth affects NOI, DSCR, cash flow, IRR, and equity multiple.
Run Rent Growth Scenarios →Why Rent Growth Assumptions Matter in Multifamily Underwriting
Rent growth is the compounding assumption in a multifamily model. It is applied every year of the hold, and every year it is applied to a larger base.
The projection itself is simple:
Future Rent = Current Rent x (1 + Annual Rent Growth Rate) ^ Years
What is not simple is everything that number then touches:
- Gross rental income in every projected year
- Effective gross income after vacancy, concessions, and bad debt
- Net operating income, because rent flows to NOI faster than expenses grow
- Valuation, since NOI divided by cap rate is how multifamily is priced
- Exit value at sale, which is usually the largest single cash flow in the model
- Annual cash flow after debt service
- DSCR in each projected year
- IRR and equity multiple
- The price you can justify offering today
That leverage is why rent growth is the assumption most often nudged upward when a deal does not pencil. It is also why it deserves the most scrutiny. In a full multifamily underwriting process, rent growth is where optimism hides most comfortably.
Why National Rent Growth Averages Are Not Enough
A national rent growth number is an average across hundreds of metros with completely different supply pipelines, employment bases, regulatory regimes, and construction cycles.
Blending those together produces a figure that describes no actual market. A national average of roughly 1% can be the arithmetic result of one set of metros running above 5% and another set running below −3%. Neither group is the average, and you will never buy a property in "the national market."
Consider what it means to apply the same rent growth assumption across:
- San Antonio, Austin, and Phoenix, where recent deliveries have been competing hard for the same renters
- New York and San Francisco, where new supply has been comparatively constrained
- Chicago and other Midwest metros, where more modest construction has met steadier demand
Underwriting all of those at 3% is not conservatism. It is the absence of a market view.
The same problem repeats one level down. Two submarkets in the same metro can behave very differently if one of them absorbed a wave of new Class A lease-ups and the other did not. A metro-level number is better than a national one, but it is still an average.
What the 2026 Multifamily Market Is Showing
The published 2026 data supports the same conclusion from three independent directions: national rent growth has been positive but limited, and market-level performance has been sharply divided.
National rent growth is modest — and the data providers do not even agree on it
The National Apartment Association's Q2 2026 Apartment Market Pulse reported a national average effective rent of about $1,894 with roughly 1.3% year-over-year growth per RealPage, while CoStar measured the same national figure at about 0.1%. Annual completions moderated to roughly 340,000 units, down sharply from the prior year, and quarterly net absorption turned negative. The release itself frames performance as remaining highly market specific.
That gap between two national readings is worth sitting with. If the national number can be 1.3% or 0.1% depending on whose panel you read, it is not precise enough to underwrite a specific property against.
Supply pressure is easing, but unevenly
Marcus & Millichap's Midyear Multifamily Outlook (July 2026) reported that multifamily starts have fallen roughly 75% from their 2022 peak and that second-quarter completions ran at about half the late-2024 pace. Second-quarter absorption exceeded 194,000 units, pulling the national vacancy rate down about 60 basis points to roughly 4.5%. The brief also noted that annual rent growth was strongest outside the Sun Belt, led by San Francisco, San Jose, Milwaukee, Cleveland, and Chicago.
Falling starts matter for years three through five of a hold, not for year one. The units already under construction still have to lease up first.
The first half of 2026 was a tale of two market groups
Multifamily Dive's July 16, 2026 summary of Yardi Matrix data reported that U.S. advertised rents rose about $4 month-over-month in June, 0.7% in the second quarter, and roughly 1% across the first half of 2026 compared with the second half of 2025 — below historical norms. Gateway and Midwest metros led, with New York around 5.6% year-over-year, San Francisco around 4.7%, Chicago around 2.6%, Kansas City around 2.4%, and the Twin Cities around 2.2%. Several Sun Belt metros were negative over the same period, including Austin near −4%, Denver near −3.1%, Tampa near −2.8%, Phoenix near −2.7%, and Houston near −2%. National occupancy slipped to about 94.1% in June.
Sources: National Apartment Association, Apartment Market Pulse Q2 2026 (July 30, 2026); Marcus & Millichap, Midyear Multifamily Outlook (July 2026); Multifamily Dive, "Multifamily rents ticked up in first half of 2026: Yardi" (July 16, 2026).
These figures describe reporting periods that have already closed. They are directional evidence about how markets have been behaving, not a forecast of what any specific property will achieve. Treat them as a reason to look up your own market, not as a substitute for doing it.
Why Sun Belt Markets Need More Conservative Rent Growth Assumptions
The Sun Belt absorbed the largest share of the recent construction wave. That supply has to be leased before pricing power returns, and lease-up competition shows up in effective rents long before it shows up in asking rents.
The specific pressures to underwrite around:
- New Class A properties in lease-up offering one to two months free, which pulls renters out of stabilized Class B product nearby
- Concessions that make advertised rent look stable while collected rent falls
- Slower absorption, which extends the period before rents recover
- Renewal negotiating power shifting to the tenant when there are alternatives across the street
- Submarket variation — a metro with negative average rent growth still contains submarkets with no new deliveries at all
None of this means Sun Belt deals are bad. Several Sun Belt metros led the country in absorption in 2026 — the demand is real. It means the underwriting has to be more precise, because the margin for error on the income side is thinner.
Practical guidance for an oversupplied submarket:
- Model flat or low rent growth in year 1, and let recovery show up later in the hold if at all
- Quantify concessions explicitly rather than netting them into a rent number
- Confirm actual achieved rents from the rent roll, not asking rents from a listing site
- Stress-test slower absorption and longer lease-up on any vacant or renovated units
- Always carry a downside case where rent growth is zero for the first two years
Why Supply-Constrained Markets May Support Stronger Rent Growth
The mirror image is a market where very little new product is being delivered. Limited new supply, stable employment, high homeownership costs pushing households toward renting, and tight occupancy can combine to give operators genuine pricing power.
That is roughly the story the 2026 data tells about several coastal gateway and Midwest metros. But a strong metro headline is not underwriting evidence for a specific building.
Before you underwrite above-average rent growth, you should be able to point to:
- Recent lease trade-outs at the subject property showing what renewals and new leases actually signed at
- Leasing comps from properties of the same vintage, class, and condition
- A rent roll that shows current rents genuinely below market, with a credible reason
- Occupancy that has held up without concessions
- A submarket supply pipeline you have checked yourself, not one summarized in the offering memorandum
The risk in a strong market is different from the risk in a weak one. In a weak market you overpay by overestimating rent growth. In a strong market you overpay by paying today for growth that is already priced into the asking price. Both end the same way.
How to Choose a Rent Growth Assumption
Work from the property outward, not from the forecast inward. A defensible rent growth assumption is built in this order:
- Start with the current rent roll — what every unit is actually paying today
- Compare current rent to market rent, unit type by unit type, to size the gap
- Review recent leasing comps for properties that are genuinely comparable in class and condition
- Check occupancy and concessions at the property and at its direct competitors
- Review the submarket supply pipeline, including units already under construction
- Compare T12 collections to annualized rent roll income — the gap is your real-world leakage
- Separate asking rent from effective rent before using any comp
- Adjust by asset class and renovation level — a renovated 2-bedroom comp does not price an unrenovated one
- Model lease expiration timing so increases land when leases actually roll
- Build base, upside, and downside scenarios instead of a single number
If you cannot explain your rent growth assumption using items from that list, you do not have an assumption. You have a placeholder.
Base Case, Upside Case, and Downside Case
One rent growth number produces one answer. Three produce a decision.
| Scenario | Rent Growth Assumption | When to Use |
|---|---|---|
| Downside case | 0% to 1% | Oversupply, concessions, weak demand, uncertain execution |
| Base case | 1% to 3% | Stable occupancy, moderate demand, supported comps |
| Upside case | 3%+ | Supply-constrained market, proven rent trade-outs, strong comps |
These ranges are examples, not rules. The correct assumption depends on the specific market, property, asset class, lease structure, and business plan.
The useful question is not which case is most likely. It is whether the deal still clears your return and coverage thresholds in the downside case. If it only works in the upside case, you are not underwriting a deal — you are underwriting a hope. That is the whole argument for running multiple scenarios on every deal.
Example: 1% vs 3% Rent Growth Over a 5-Year Hold
Take a property with $1,800,000 of current annual rental income and hold it for five years. The only thing that changes between the two columns is the rent growth assumption.
| Year | 1% Rent Growth | 3% Rent Growth |
|---|---|---|
| Year 1 | $1,818,000 | $1,854,000 |
| Year 2 | $1,836,180 | $1,909,620 |
| Year 3 | $1,854,542 | $1,966,909 |
| Year 4 | $1,873,087 | $2,025,916 |
| Year 5 | $1,891,818 | $2,086,693 |
By year 5, the 3% case shows about $194,875 more annual rental income than the 1% case. Two percentage points, compounded five times.
If the operating margin is 55%, that additional income implies roughly $107,181 more NOI in year 5:
$194,875 x 0.55 = $107,181
At a 6.50% exit cap rate, that NOI difference implies roughly $1.65M of additional exit value:
$107,181 / 0.065 = $1,648,938
On a deal of this size, changing one assumption from 1% to 3% moves projected exit value by more than a million and a half dollars — before any change to the exit cap rate, which compounds the swing further.
This is a simplified illustration on invented figures. It is not a projection for any real property. The point is the sensitivity: an assumption capable of moving the answer by that much should never be chosen by habit.
How Rent Growth Affects DSCR and Loan Sizing
Higher rent growth improves projected NOI, and higher projected NOI improves projected DSCR in later years. That part is straightforward.
The trap is assuming it helps you at closing. Lenders generally size debt against current or stabilized NOI — what the property is producing now, or what it can be shown to produce in the near term — not against an optimistic year-5 projection. Your model may show DSCR climbing to 1.45 by year 5. The lender is looking at day one.
Two consequences follow:
- A deal with weak day-one coverage is a weak deal today, regardless of what the projection does later. Future rent growth does not fix a 1.05 DSCR at closing.
- If your proceeds assumption quietly depends on projected rather than current NOI, your equity requirement is understated and your returns are overstated.
Check DSCR in the downside case in year 1, not just the average across the hold. That is the number that determines whether you can carry the property through a slow leasing year.
Common Rent Growth Underwriting Mistakes
- Using 3% every year, in every market, with no supporting evidence
- Using asking rents instead of effective rents
- Ignoring concessions, which quietly reduce collected rent while advertised rent looks flat
- Ignoring new supply that is already under construction in the submarket
- Treating market rent as immediately achievable rather than achievable as leases roll
- Applying renovated rent comps to unrenovated units
- Ignoring lease expiration timing, so increases are modeled months before leases actually roll
- Not comparing the rent roll to the T12, and missing the collection gap between them
- Forgetting that pushing rents harder usually increases vacancy and turnover
- Modeling only one scenario, which hides how fragile the answer is
Most of these share a root cause: using a number that describes the market instead of a number that describes the property.
How DealWorthIt Helps Investors Underwrite Rent Growth
DealWorthIt is built around the part of underwriting that rent growth actually sits in — connecting the property's own documents to the assumptions in the model, then testing those assumptions.
With DealWorthIt, you can:
- Compare current rent against market rent, unit type by unit type
- Review rent roll and T12 inputs side by side instead of in separate spreadsheets
- Analyze NOI, DSCR, cash flow, IRR, and equity multiple from the same set of inputs
- Run base, upside, and downside scenarios on the same deal
- Stress-test rent growth and exit cap assumptions together and see which one moves the return most
- Review market data and comparable properties when setting your market rent view
- Generate investor-ready reports that show the assumptions, not just the answer
The goal is not to make the rent growth assumption look good. The goal is to see whether the deal still works when the assumption is wrong.
See plans and pricing to find the tier that fits how many deals you underwrite.
Frequently Asked Questions
What is a good rent growth assumption for multifamily underwriting?
There is no single correct number. A defensible assumption is derived from the property's rent roll, recent leasing comps, occupancy, concessions, and the submarket supply pipeline. As a starting frame, many investors model 0% to 1% in a downside case, 1% to 3% in a base case, and above 3% only where trade-outs and comps clearly support it.
Is 3% rent growth still conservative in 2026?
Not universally. Published 2026 data showed several large Sun Belt metros with negative year-over-year advertised rent growth, where 3% would be aggressive. In some supply-constrained coastal and Midwest metros, reported growth ran well above 3%. Whether 3% is conservative depends entirely on the market, the submarket, and the property.
Should I use national rent growth forecasts in my pro forma?
Use them for context, not as the input. A national figure blends markets moving in opposite directions and describes no individual property. In 2026 two major data providers reported national rent growth at roughly 1.3% and roughly 0.1% for the same quarter, which shows how imprecise the national view is for underwriting a specific deal.
How does rent growth affect NOI?
Rent growth increases rental income, which increases effective gross income, which increases NOI to the extent that operating expenses do not rise at the same rate. Because NOI drives valuation, small changes in rent growth compound into large changes in projected exit value.
How does rent growth affect DSCR?
Higher rent growth raises projected NOI, which raises projected DSCR in later years. It does not improve day-one coverage, because lenders generally size debt on current or stabilized NOI rather than on projected future income.
How should I underwrite rent growth in a Sun Belt market?
More conservatively and more specifically. Check what new supply has delivered or is under construction in the submarket, quantify concessions, use achieved rather than asking rents, model flat or low growth in year 1 where lease-up competition is active, and confirm the deal still works in a zero-growth downside case.
What is the difference between asking rent and effective rent?
Asking rent is the advertised price. Effective rent is what the landlord actually collects after concessions such as free months, waived fees, or move-in credits. A property advertising $1,600 with one month free on a 12-month lease is collecting closer to $1,467 in effective rent. Underwriting against asking rents overstates income.
Final Takeaway
Rent growth is one of the most powerful assumptions in a multifamily underwriting model, but it is also one of the easiest to misuse.
In 2026, national averages are not enough. Investors need to underwrite rent growth at the market, submarket, property, unit, and lease level.
A 3% rent growth assumption might be reasonable in one market and reckless in another. The only way to know is to compare the rent roll, T12, comps, concessions, supply pipeline, and downside scenarios.
Before you make an offer, run the rent growth assumption through multiple scenarios. DealWorthIt helps investors compare rent growth assumptions, stress-test NOI and DSCR, and decide whether the deal is worth pursuing.
Ready to analyze your next deal?
Find, research, analyze, compare, and present real estate deals with DealWorthIt.
Related workflow in DealWorthIt: Multifamily
← Back to all articles